Managing your trading exposure is like playing Jenga in the dark. One wrong move could ruin your hard work. The goal is not to avoid risk but to handle it carefully.
True profit stability comes from being precise. It’s about building a strong base of predictable returns.
Exposure management is key to this. It turns you from a gambler into the house. It uses tools like cognitive bias to create a structured process.
This isn’t just about avoiding disaster. It’s about creating a profit machine. With data-driven risk management, you turn volatility into a tool for growth.
The outcome is not just survival. It’s a stable, predictable engine for growth. You become the owner of the game, not just a player.
Mapping Exposure by Sport/League/Market
Your sportsbook’s exposure map is more than a spreadsheet. It’s a dynamic, living atlas. If you’re using an outdated map, you’re not managing risk well. Exposure management is about detailed cartography, not just alerts.
Using the same map for Manhattan and the Australian Outback is silly. You can’t assess sport-specific risk the same way for all sports. A Premier League match is different from an e-sports tournament. Treating them equally can lead to unseen exposure.
The Blueprint: Your Multi-Dimensional Risk Atlas
An effective exposure map is detailed and real-time. It has a sport-specific risk profile. The risk of a last-minute field goal in the NFL is different from a soccer goal.
League and competition details matter too. The exposure limits for a regular-season MLB game are different from the World Series. This shows the importance of market segmentation.
Market segmentation is more than theory. It’s about understanding each market’s unique risk. For example, the English Premier League’s Over/Under 2.5 goals market is different from the “Both Teams to Score” market in the same match.

The best operators look at these segments together. They see how they correlate. For example, a surge in moneyline bets on Team A in the NBA might affect the point spread market.
This makes your exposure map a living risk model. It’s like understanding the complex connections between cities, not just looking at a list.
From Heatmap to Crystal Ball
The goal is to predict market movements. A sport-specific risk model can warn you about high-risk bets. This isn’t about avoiding risk, but managing it.
This approach is both defensive and offensive. It lets you take smart positions in markets where you have an edge. You’re not just avoiding danger; you’re finding the best path through the market.
Mapping exposure is like seeing the whole battlefield, not just the front lines. It turns a complex problem into a manageable map. You become the one in control, not just reacting to market changes.
Setting Liability Caps and Auto-Stops
Think of your liability caps as the speed limit on a treacherous mountain road. It’s a good idea, but it’s useless without guardrails. Anyone can post a sign. The real protection comes from the automated system that enforces it.
This is the problem with a cap without an auto-stop. It’s like financial theater. You set a maximum, then hope people follow it while markets change fast. The pros know this won’t work. A hard limit is just the start. The main event is the auto-stop—the system that acts fast, without hesitation.
Technology like Tapaas, used in platforms like DXtrade, changes risk management. It’s not about building a higher wall. It’s about installing smart, automatic floodgates. When exposure hits a certain risk threshold, the system acts fast, without asking permission.
The difference is huge. It’s the difference between a small problem and a big crisis. It’s your automated, 24/7 risk guard, working while you sleep. This idea is similar to the legal need for clear policy limits in third-party claims—knowing the limit is important, but only if you can enforce it.
Let’s look at why the automated approach is better:
| Feature | Manual Liability Cap | Automated Auto-Stop System |
|---|---|---|
| Enforcement | Relies on trader discipline & monitoring. | Mechanical, rule-based, and unforgiving. |
| Reaction Time | Seconds to minutes (human lag). | Milliseconds (system trigger). |
| Emotional Interference | High (“Just one more bet…”). | Zero. It follows the code. |
| Scalability | Poor. Cumbersome across 1000s of markets. | Excellent. Rules apply uniformly at scale. |
| Typical Outcome | Creeping breach, panic response. | Clean halt, controlled exposure. |
The table shows the difference. A manual cap is just a suggestion. An auto-stop is a rule. By setting clear risk thresholds and using real-time analytics, you achieve stability. Your liability management becomes a simple setting on a dashboard.
In the end, profit stability isn’t about having limits. Every book has those. It’s about having limits that can’t be ignored. That’s the guardrail. That’s the sentinel. That’s the auto-stop.
Netting Rules for Parlays and SGPs
Same-Game Parlays (SGPs) are like high-stakes financial bets. They mix different sports bets into one big wager. But, if you don’t manage the risks right, it can lead to big losses.
Position netting helps you see the big picture. It’s not about tracking every bet separately. It’s about understanding the overall risk. This way, you can avoid huge losses.
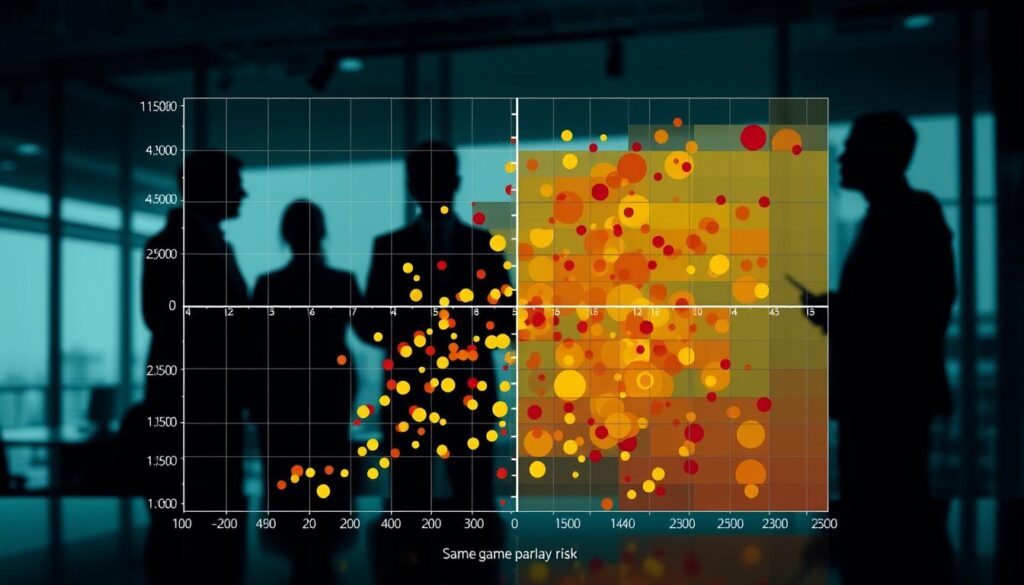
Correlation is a big risk in SGPs. Bets like “Player A to score a touchdown” and “Team B to win” are connected. A single event can affect many bets, increasing the risk.
Modern books use advanced tools to manage these risks. They look at how different bets are connected. This helps them spot hidden dangers.
Think of parlays as threads. Position netting weaves them together. Without it, managing risks is like trying to stop a fire from spreading.
The best operators see SGPs as complex risks to manage. They use position netting to balance their bets. This turns a risky situation into a safe one.
Real-Time Dashboard KPIs: The Heartbeat of Your Risk
In the fast-paced world of sports trading, a dashboard that’s not up-to-date is a big problem. If your risk dashboard is updated daily, you’re already behind. In sports and finance, real-time data is essential, not a luxury.
Forget about static reports. We need a dynamic command center. This is your mission control, where every real-time KPI is a vital sign. A flatline means you’re in trouble.
The goal is to see what’s about to happen, not just what happened. It’s like feeling the wind shift before a storm hits.
The centerpiece of this command center is Value at Risk (VaR). But we’re not talking about a static, end-of-day number. A real-time VaR is a living, breathing metric that pulses with the market’s every heartbeat. It’s the difference between knowing your exposure to a key player’s injury during a game and just knowing you have a lot of money on the line. It’s a predictive stress test, not a post-mortem.
From a Single Number to a Strategic Narrative
Smart traders don’t just look at the VaR number; they read the story it’s telling. They pair it with two other critical KPIs:
- Worst-Case Scenario (Stress Test): This isn’t about what you expect to lose on a normal day. This is the “what if” scenario. What if that star quarterback is a surprise scratch? What if the entire league’s totals go over simultaneously? This KPI isn’t for the faint of heart—it shows you the worst plausible financial storm your book could weather.
- Cluster Risk Exposure: This is the silent killer. It’s not about one bet going bad. It’s about realizing that your 20 different bets on “under” totals are all, in fact, the same bet on low-scoring games. A real-time dashboard doesn’t just show you the individual bets; it shows you the hidden connections. It tells you when your entire book is leaning on the same outcome, a single point of failure just waiting to collapse.
Platforms like Beacon by CWAN synthesize this chaos into a coherent narrative. They don’t just present numbers; they visualize the web of your exposure. This isn’t just data; it’s a live-action blueprint of your risk.
The most critical KPI of all is the speed of information. In a market where odds shift in milliseconds, a delay of even a few seconds can be the difference between a strategic hedge and a significant loss. Your dashboard must be a live feed, not a daily digest. The goal is to move from reactive exposure management to proactive risk prevention.
Ultimately, a real-time dashboard isn’t a reporting tool. It’s a central nervous system for your book. The VaR is its pulse, the cluster risk analysis is its nervous system, and the worst-case scenario is its immune system, constantly stress-testing your exposure. In this game, the only real risk is not seeing it all coming.
Alerting and Trader Workflows
A flood of alerts is just noise; a targeted, intelligent alert is a command to act. In sports trading, the difference between a fire alarm and a beep is huge. The right alert at the right time can mean profit or loss.
Modern risk management is about smart alerts that talk to traders in their own language. It’s about fitting into their workflow, not just sending out alerts.
Forget the old days of alerts for every little thing. Today’s alerting systems are precise. They send out clear, actionable messages, not just “BREACH!”
Imagine an alert that says, “NBA Totals Exposure Limit Breach” but also gives details. It might say, “Player Prop, Denver @ Lakers, Total Points Over 230.5: Exposure is 15% over cap. Suggested action: Lay off $5k on Market X.” This turns a trader into a strategic commander.
The art of trader workflows meets the science of risk here. A good alert doesn’t interrupt; it fits right in. It sends a message, auto-fills a hedge ticket, and logs the action. This makes trading smooth and controlled.
This is the digital last mile, where data meets action. It’s explored in our analysis of reimagining trader workflows for the AI era.
The best alerts come from backtesting. They’re not based on guesses or generic rules. They’re based on what historical models show will happen under pressure.
This is the symphony of a mature alerting system. It’s a finely-tuned orchestra of data, not a mess of beeps and buzzes.
| Component | Basic Alerting (Noise) | Intelligent Alerting (Signal) | Impact on Trader Workflow |
|---|---|---|---|
| Trigger | Breach of a single, static exposure limit. | Multi-factor breach: exposure, velocity of change, market liquidity, and correlated events. | Alerts are relevant, contextual, and tied to a specific market or league. |
| Delivery & Context | Generic email blast to “trading desk.” | Push notification to a specific trader’s device with sport, market, breach size, and a suggested action. | Eliminates confusion. Trader sees the “what,” “where,” and a data-driven “what next.” |
| Actionability | “Exposure Limit Breach on NBA Totals.” | “NBA Totals exposure on LAL vs. DEN is 120% of cap. Hedge suggestion: Lay $5k on Under 228.5 at Bet365.” | Transforms an alert into an immediate, executable decision point within the trader’s workflow. |
| Integration | Stand-alone alert log. Trader must switch apps to act. | Alert contains one-click “Hedge” button linking directly to trading platform with ticket pre-filled. | Reduces reaction time from minutes to seconds, keeping trader workflows fluid and efficient. |
An alert is not just an alert. It’s a key link in a trading operation’s nervous system. It connects risk management to market execution. The goal is to make each alert precise and actionable, like a trusted instruction.
Post-Match Review and Governance
The final whistle blows, but the game isn’t over. The real work of governance starts after the last bet settles. This is the post-trade analysis, a detailed check of your risk management plan.
This review is like an autopsy that helps avoid future problems. Did the liability caps work during a sudden surge? Did the auto-stops work as planned, or did they fail? Did our VaR models catch the real-world volatility, or did we miss something?
This review isn’t just about checking boxes. It’s a deep, honest look at what happened. The aim is to learn, not to blame. Was the model flawed, or was the rule too weak? The insights from this review improve the system, turning close calls into strong rules.
Good governance isn’t just about reports. It’s a constant, detailed process of learning from past mistakes. It’s how you make your system smarter and stronger. This is where data turns into valuable knowledge, and post-trade analysis is key to your next success.