What makes a financial setup strong or weak? It’s not just the materials used. It’s the way they’re put together, with the house bankroll at the core. This isn’t just money; it’s the lifeblood of the house, breathing in risk and breathing out profit.
Imagine your bankroll as the house’s life force. It’s not a fixed number but a living entity that guides every decision. Is your bankroll cautious or bold, like a Vegas high roller?
The art of risk and the science of probability come together here. The Kelly Criterion isn’t just for experts. It’s a guide for smart betting, showing how much of your bankroll to risk when you have an advantage.
So, forget about making reckless bets. Your bankroll is your investment fund. Your risk appetite is a strategy, not a mood. The house doesn’t gamble; it calculates every move.
Tiered Limits by Market Quality and Hold
Imagine you’re a sommelier, but instead of wine, you’re pairing risk with reward. You wouldn’t serve a 1982 Château Margaux at a dive bar. And you shouldn’t treat a Tuesday night table tennis match the same as the Super Bowl when setting your liability per market. Treating all markets equally is like using a sledgehammer to crack a nut—it’s inefficient and messy.
This is where a tiered liability system comes in. Just as a sommelier matches wine to the occasion, we must match our exposure to the market’s quality and liquidity. A tiered system grades each sport or league like a Moody’s for money. An NFL Sunday is your blue-chip, AAA-rated investment. A mid-week Belarusian darts qualifier? That’s a speculative junk bond.
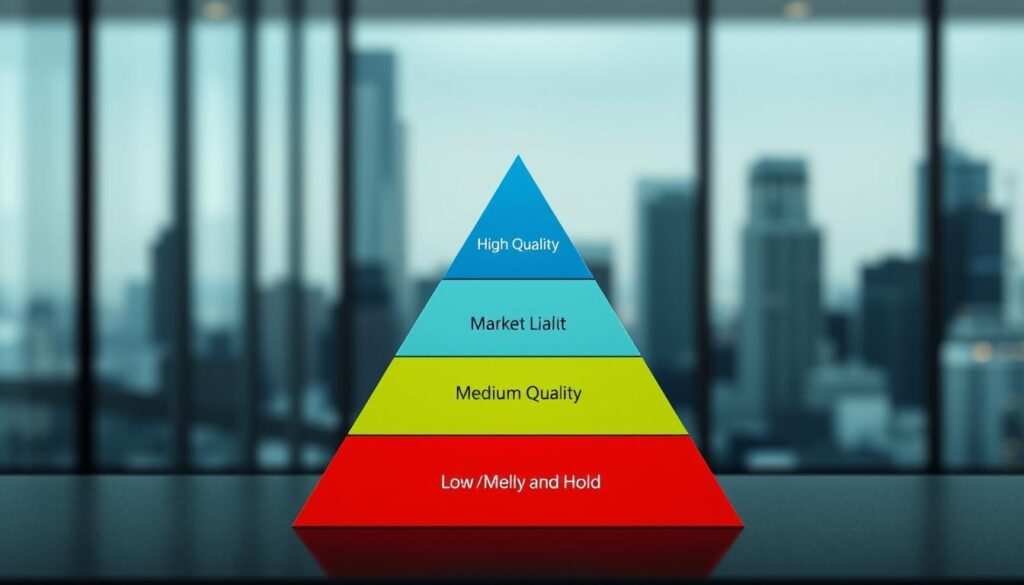
Our NBA data is a perfect case study. Tracking a team’s performance against the spread (ATS) and the sportsbook’s hold percentage gives us a clear risk profile. A team on a 10-2 ATS run? That’s a high-volatility asset. The market’s hold percentage—the book’s theoretical profit margin—is equally critical. A high-hold, one-sided market is a liability trap. Our tiered system is built on this data, not gut feel.
The Tiered Liability Menu
Think of it as a risk sommelier’s list, with three main tiers:
- Blue-Chip Tier (Tier 1 – The Connoisseur’s Choice): Your NFL Sundays, NBA Playoffs, Premier League title deciders. High liquidity, massive volume, and razor-thin margins. Here, liability per market can be highest, as the sheer volume of action provides a natural hedge. This is your Château Lafite Rothschild.
- Mid-Market Tier (Tier 2 – The Reliable Vintage): Major league regular season games, major tennis tournaments, and top-tier European football. Consistent, reliable, and with a predictable hold. Your player retention strategy thrives here, with steady, manageable action.
- Niche/Speculative Tier (Tier 3 – The House Wine): This is where you find your Belarusian darts. Niche sports, lower-tier leagues, or markets with less than 24 hours of pre-match liquidity. The liability per market here is minimal. The goal isn’t to make money here, but to offer coverage and variety, much like a casino.
Applying the NBA Model League-Wide
Let’s apply our NBA insight league-wide. We track each team’s ATS record and the market’s hold percentage. A team on a hot ATS streak in a market with a low hold percentage? That’s a high-liability per market scenario for the book. We’d bump that game down a tier, lowering the max bet to limit exposure.
Conversely, a market with a high hold on a game with no clear favorite is a lower-risk, lower-liability situation.
This isn’t just about limiting losses; it’s about intelligent capital allocation. It’s the difference between a hedge fund and a gambler. The hedge fund (your book) allocates capital (liability) based on a risk-adjusted model. The tiered system is that model. It ensures you’re not overexposed to a niche sport upset while having the capacity to handle the flood of action on the Super Bowl. It’s the financial equivalent of not betting the farm on a single, unrated junk bond.
In essence, this tiered approach is your first, best defense against volatility. It’s the risk management equivalent of not putting all your eggs in one basket, except you’ve carefully sorted the eggs by size, shell thickness, and the likelihood of the chicken being on a hot streak. For a deeper dive into the math behind capping your exposure, the principles of Value at Risk (VaR) are a natural next step.
Seasonal/Peak Event Adjustments
Managing a risk tier is like a science, but adjusting for seasonal peaks is an art. It’s like the financial meteorology of gaming. A shop doesn’t stock the same items in December as in July, and a smart operator doesn’t set the same limits on quiet days as on big events.
This isn’t just guessing; it’s strategic planning. We predict betting trends like a weather forecaster. Big events like the Super Bowl or the Champions League final are our “perfect storms.” Betting volume and volatility skyrocket.
Our data shows that fatigue and schedule density affect performance and betting line volatility. A team tired from travel isn’t the same as a well-rested one. Ignoring this is like ignoring a hurricane forecast.
To adjust risk tiers for these events, we build a new structure. It’s a complex equation. The table below shows our main adjustment framework for different event tiers.
| Event Tier | Event Examples | Primary Limit Adjustment | Rationale & Volatility Factor |
|---|---|---|---|
| Global Peak (Tier 1) | Super Bowl, FIFA World Cup Final | Increase limits by 300-500% for main markets | Unprecedented volume, global attention, and prop-bet mania create extreme, short-term volatility. The house needs to capture action but limit single-bet exposure. |
| Major Championship (Tier 2) | NBA Finals Game 7, Champions League Final | Increase limits by 150-250% | High-stakes, winner-take-all pressure. Player prop and in-play markets see massive spikes. Limits are raised to manage liability on high-volume, sharp-driven bets. |
| Seasonal Peak (Tier 3) | March Madness (opening weekend), NFL Week 1 | Increase limits by 100-200% | Massive, concentrated volume from casual bettors. Limits are raised to accommodate public money while adjusting for the “public square” effect on line movement. |
| Regular Season Peak (Tier 4) | NFL Sunday, Marquee NBA/EPL Matchup | Increase limits by 50-100% | Standard high-volume periods. Adjustments are moderate, focused on managing concentrated action on popular teams/players. |
Think of it as a dynamic defense. In the regular season, you might play a zone. But in the playoffs, you’re in a full-court press. The limits aren’t just higher; they’re smarter.
We’re not just increasing all limits across the board. We’re surgically adjusting for specific bet types. This way, we’re ready for where public sentiment and sharp action will collide most intensely.
This isn’t about fear; it’s about precision. A retail store doesn’t stock the same inventory for Black Friday as it does on a random Tuesday. We apply the same logic. By using data on team travel, player fatigue, and historical volatility, we predict betting trends. This approach transforms seasonal peaks into opportunities. It’s the difference between being caught in the rain and building an ark. For more on smart betting strategies, explore these smart betting strategies.
Limit Simulation and Stress Bands
Think of your bankroll as a skyscraper in a seismic zone. You don’t wait for the earthquake to see if it collapses. You stress-test it. That’s what we do with capital. We don’t just set limits; we simulate every possible financial earthquake to see what breaks first.
We run Monte Carlo simulations—think of it as a digital crash-test dummy for your money. We don’t just model a few bad days; we simulate thousands of possible futures. This includes those once-in-a-century black swan events. The goal isn’t to avoid risk, but to understand exactly where our limits should be.
The Martingale system is a perfect cautionary tale. It’s the gambling world’s “can’t lose” strategy. You double your bet after every loss, confident that a win will eventually recoup all losses. It’s the financial equivalent of a “sure thing.” Until it isn’t. It’s a mathematical guarantee of ruin disguised as a system. Our stress bands are the antithesis of this. We don’t double down on stupid; we model for the 100-year flood.
So, what do these simulations look like in practice? We establish three zones:
- Green Band (Operational): The daily, comfortable operating zone. The bankroll is working, but well within tested limits.
- Yellow Band (Caution): Stress levels are rising. Our models show a deviation from the norm. This is the “proceed with caution” signal.
- Red Band (Action Required): The simulation-tested limit. This is the “hard stop” where we know, based on our crash tests, that the probability of a terminal loss becomes unacceptably high.
This isn’t about avoiding losses—that’s impossible. It’s about defining the exact moment a calculated risk becomes a reckless gamble. It’s the difference between a pilot with a pre-flight checklist and one who just “goes for it.” For more on managing risk in volatile environments, our analysis of day trading’s profit explores the same principles of risk-containment.
Ultimately, the size of your bankroll is less important than the precision of its guardrails. A well-defined, stress-tested limit isn’t a cage; it’s the guardrail on a mountain road. It doesn’t tell you not to drive. It just makes sure you don’t drive off the cliff.
Communication to VIP/CRM/Sales
Talking to a high roller about reducing their limits is like a high-stakes meeting. Every word is important, like a treaty. It’s not just about telling them something; it’s about keeping their trust.
Your CRM is like a secret report on their betting habits. You look at their liability per market to understand their betting patterns. It’s not about taking away their chips out of anger. It’s about protecting the casino’s interests, like a wise general avoiding a losing battle.
So, how do you tell them? You say you’re adjusting their risk to protect them, not punish them. “Mr. Big, our data shows you’re betting too much on one thing. We’re spreading your liability per market to keep you safe and give you the best games.” It’s not taking away their access; it’s making their play safer.
This is where the Art of War meets the art of upselling. You can’t make them feel like they’re losing something. It’s a smart move. If they love slots, you say, “We see you love ‘Mega Fortune.’ We’re focusing your play on what you enjoy most.” You’re not taking away; you’re making their experience better.
In the end, it’s not just about saving money. It’s about keeping the relationship strong. A limit reduction can actually make them more loyal. They don’t feel limited; they feel understood. It’s a partnership, not management. In VIP relations, the message is everything.
Monitoring Breach Protocols
Our monitoring system is like the DEFCON status of a house. It’s our nuclear football, always ready but never used. When a player or market situation causes a breach, we stay calm. We have a detailed plan for each risk level, focusing on smart returns.
Our response is based on risk levels. A small breach in a low-risk area might send an alert. But a big breach in a high-risk area gets a full alert system. We don’t think a win is “due” after a loss. We make decisions based on data, not emotions.
This isn’t about stopping action; it’s about careful management. We don’t follow the idea that “black is due” after a loss. Our system is the opposite. Every alert and action is a smart move to keep the house’s edge. We watch breaches closely and have plans for every risk level. Our goal is to keep the house winning in the long run.