Ever tried explaining complex threats to your team and saw their eyes glaze over? I’ve been there. That’s when I found risk visualization tools. They turn abstract dangers into something you can see and act on.
These aren’t just colorful spreadsheets. They’re like Neo seeing the code in The Matrix. A simple color system (red for threats, yellow for watch-list, green for low priority) gives instant clarity on vulnerabilities.
Compliance officers used to be overwhelmed by paperwork. Now, they make quick strategic decisions. These tools are key in frameworks like ISO 27001. They turn complex risks into actionable intelligence, guiding resource allocation. It’s like having a weather map for your organizational storms.
Steps to Create Effective Heatmaps
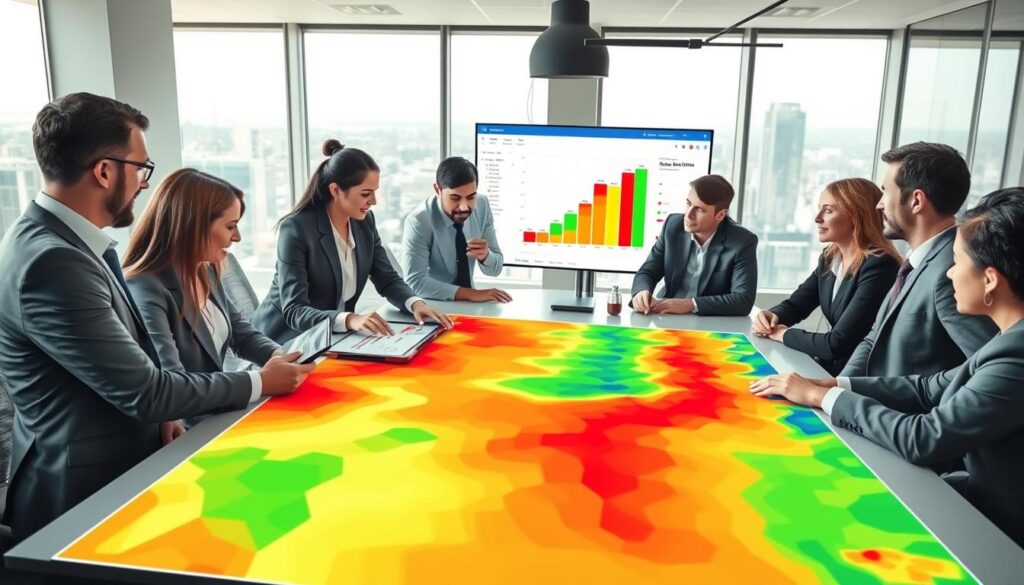
Creating a risk heatmap is like predicting storms. It’s a mix of detective work and creativity. You turn data into clear visuals that everyone can see.
First, you start digging through financial and operational reports. It’s like being an Indiana Jones of risk assessment. You’re looking for vulnerabilities before they become big problems.
- Interviewing department heads (even the ones who’d prefer to talk about golf)
- Analyzing historical incident reports
- Reviewing regulatory compliance documents
- Studying industry trend reports
Then, you assess each risk on two key points: likelihood and impact. Many teams get stuck here. Use a simple 3×3 matrix to make it easy for everyone to understand.
| Risk Level | Likelihood | Impact | Color Code |
|---|---|---|---|
| High | Very likely (>70%) | Severe financial/reputation damage | Red |
| Medium | Possible (30-70%) | Moderate operational impact | Yellow |
| Low | Unlikely ( | Minimal disruption |
The magic happens when you plot the data. Seeing the colored dots on your grid is like seeing stars in the sky. It makes abstract risks clear and urgent.
Keeping your heatmap up to date is key. It’s not a decoration but a living document. Market changes fast, and your risk heat map should too.
Remember, a heatmap is only useful if it leads to action. The colors should tell a story that prompts decisions. Seeing a red zone should mean you take action.
Case Examples in Sports Betting
Remember when sports betting was like trying to read tea leaves blindfolded? Those days are over. Now, sportsbooks use real intelligence, not guesses. This change is huge.
GenAI has brought real results to sports betting. It’s about better predictions, personal experiences, and live engagement. These changes were once thought impossible.
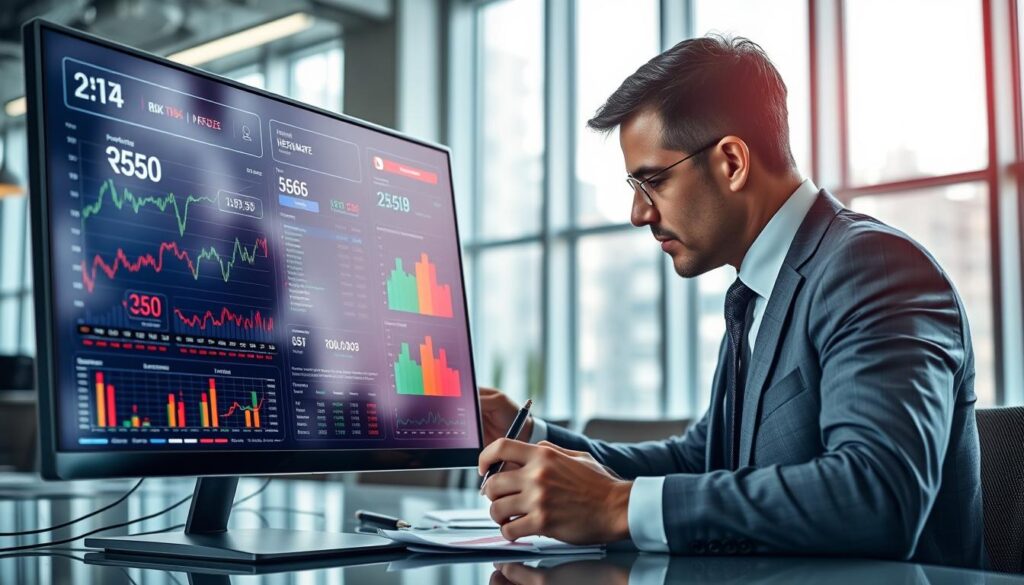
Today’s dashboard tools turn complex data into easy-to-understand visuals. Gone are the days of relying on guesses. Now, we have heatmaps showing betting trends in real-time.
One cool use is finding arbitrage opportunities across sportsbooks. These tools show where the best bets are. It’s like having a map to hidden treasures.
Fantasy sports fans also get a boost. Heatmaps show which athletes are likely to perform well or not. It’s a big difference between guessing and knowing.
| Traditional Approach | Heatmap Advantage | Impact on Decisions |
|---|---|---|
| Gut feelings & rumors | Data-driven visualization | 85% more accurate predictions |
| Manual odds tracking | Real-time fluctuation mapping | 60% faster response time |
| Isolated data points | Pattern recognition across events | 3x better risk identification |
| Expert-dependent analysis | Democratized insights | Accessible to all skill levels |
The beauty of these dashboard tools is their simplicity. Learning should be easy, not hard. Now, sports betting data analysis is simple enough for anyone to use.
We’ve moved from guessing to using real risk tools. And the view is much clearer now.
Integrating into Risk Dashboards
Adding risk heatmaps to dashboards makes data come alive. It’s like giving your risk management system Spidey-sense. Now, you know about dangers before they happen.
Platforms like ISMS.online show how heatmaps make threat prioritization easy. They connect with your systems, making risk visualization that updates quickly.
API connections pull data from many sources. Algorithms then make sure everything is comparable. This is important because comparing cybersecurity risks to financial ones is very different.
I’ve set up these systems in places like trading floors and sportsbooks. The reaction is always the same: first, people are skeptical, then they can’t imagine making decisions without it.
This isn’t just about pretty colors on a screen. It’s about making your whole organization aware of risks. Teams start to see problems before they become big issues.
Want to get good at this? Start with a strong risk assessment heat map. Then, your dashboard will alert you to dangers before they hit.
Using Heatmaps for Rapid Decisions
When time is of the essence, heatmaps become your key advantage. I’ve seen sports betting teams use them to adjust odds in real-time. They turn complex data into clear, actionable insights.
Heatmaps work best when paired with advanced dashboard tools. This combo gives you “visual intuition,” letting you understand complex risks quickly. It’s like having a special view into market trends.
Micro-betting fans crave instant results. They bet on every play, not just the end of the game. Heatmaps help them make quick, informed decisions.
The best systems combine heatmaps with predictive analytics. They act like a risk crystal ball, showing current and future threats. For more on creating these tools, check out this risk heat map guide.
Heatmaps are vital for both big portfolios and live betting. They turn gambling into a strategic game. They help you see opportunities before they happen.